
Post-Purchase Survey Attribution for Shopify Brands
Priya Raghunathan
E-commerce Performance Manager
Post-purchase survey attribution asks the people who just bought from you how they found you, then counts the answers by channel. A single "How did you hear about us?" question on the thank you page catches what pixels cannot see: a podcast mention, a creator video, a friend's recommendation. It does not replace platform data, but it shows where that data undercounts or overcounts.
Quick answer: Add one question, "How did you first hear about us?", to your Shopify thank you or order status page with a survey app. Offer 8 to 12 shuffled answers plus "Other". Collect at least a few hundred answers, then compare each channel's share with the new-customer orders that platform reports. Treat big gaps as questions to test, not as the true answer.
This guide is for Shopify brands. If your problem is that Meta and your store report different totals, start with why Meta and Shopify numbers don't match. For how platforms credit sales by click or view, see the Meta attribution setting.
What does a post-purchase survey capture that pixels miss?
A post-purchase survey records the buyer's own account of how they discovered you, which fills gaps that click and view tracking leaves by design.
- Channels without a pixel. Podcasts, YouTube creators you did not pay through ads, newsletters, retail displays and word of mouth never fire a conversion event.
- The first touch. Platforms credit the touches inside their own windows. A shopper who first saw you on TikTok three weeks ago and bought after a Google search shows up as a Google sale. The survey can recover TikTok.
- Cross-device journeys. Someone who watched an ad on a phone and bought on a laptop may not be matched by the platform. They still remember the ad.
- Organic social. A creator post, a reshared review or your own Instagram content often gets answered as "Instagram", whether or not you ran ads there.
The cost of this view is that it comes from memory, which has its own biases, covered below. That is why a survey works best as a second opinion next to platform data and store orders, not as the only source. Our guide to first-touch vs last-touch attribution explains why each method credits a different channel.
Where does the survey go on Shopify?
The survey appears after payment, on pages Shopify lets apps extend, so it never slows down checkout itself.
Shopify's help page on checkout apps lists the thank you and order status pages among the pages you can customise with app blocks, available on the Basic Shopify plan or higher. After you install an app, you add it as a block in the checkout and accounts editor. The same page notes that post-purchase apps, which show content before the order confirmation page, can add customer surveys or upsell offers.
Shopify's help pages describe surveys as something apps add, so you need one. Two that describe attribution surveys on their Shopify App Store listings, with prices as of November 2026:
- Fairing (listing) runs post-purchase surveys "on your thank you & order status pages" and analyses lifetime value against survey answers. The listing shows a free plan up to 200 orders a month, then $49, $99 and $149 a month for up to 500, 1,000 and 5,000 orders.
- KNO Post Purchase Surveys (listing) offers "post-purchase surveys to gain attribution insights from customers", with templates, conditional logic and attribution reports. The listing shows plans at $19, $119 and $299 a month.
For a wider view of the Shopify apps an ads stack needs, see our list of the best Shopify apps for ads.
How should you write the question and answers?
The wording decides how useful the answers are, so spend more time on the answer list than on the app.
The question. "How did you first hear about us?" works better than "How did you hear about us?" because it asks for discovery, not the last reminder. A returning buyer asked the second version will often answer "email", because the email brought them back.
The answers. Follow a few rules:
- Split platforms you buy separately. Facebook, Instagram, TikTok, YouTube, Google search, Pinterest, Snapchat. "Social media" as one option is useless for budget decisions.
- Add the channels you cannot track. Podcast, friend or family, creator or influencer, press article, in a shop, other.
- Keep the list to 8 to 12 options, so it fits on a phone screen without scrolling.
- Shuffle the order for each buyer. People pick options near the top more often, and shuffling spreads that effect evenly.
- Make "Other" a text field. Read it monthly and promote frequent answers to their own option.
- Add one follow-up where it pays: "Which podcast?" or "Which creator?" turns a vague answer into one you can act on.
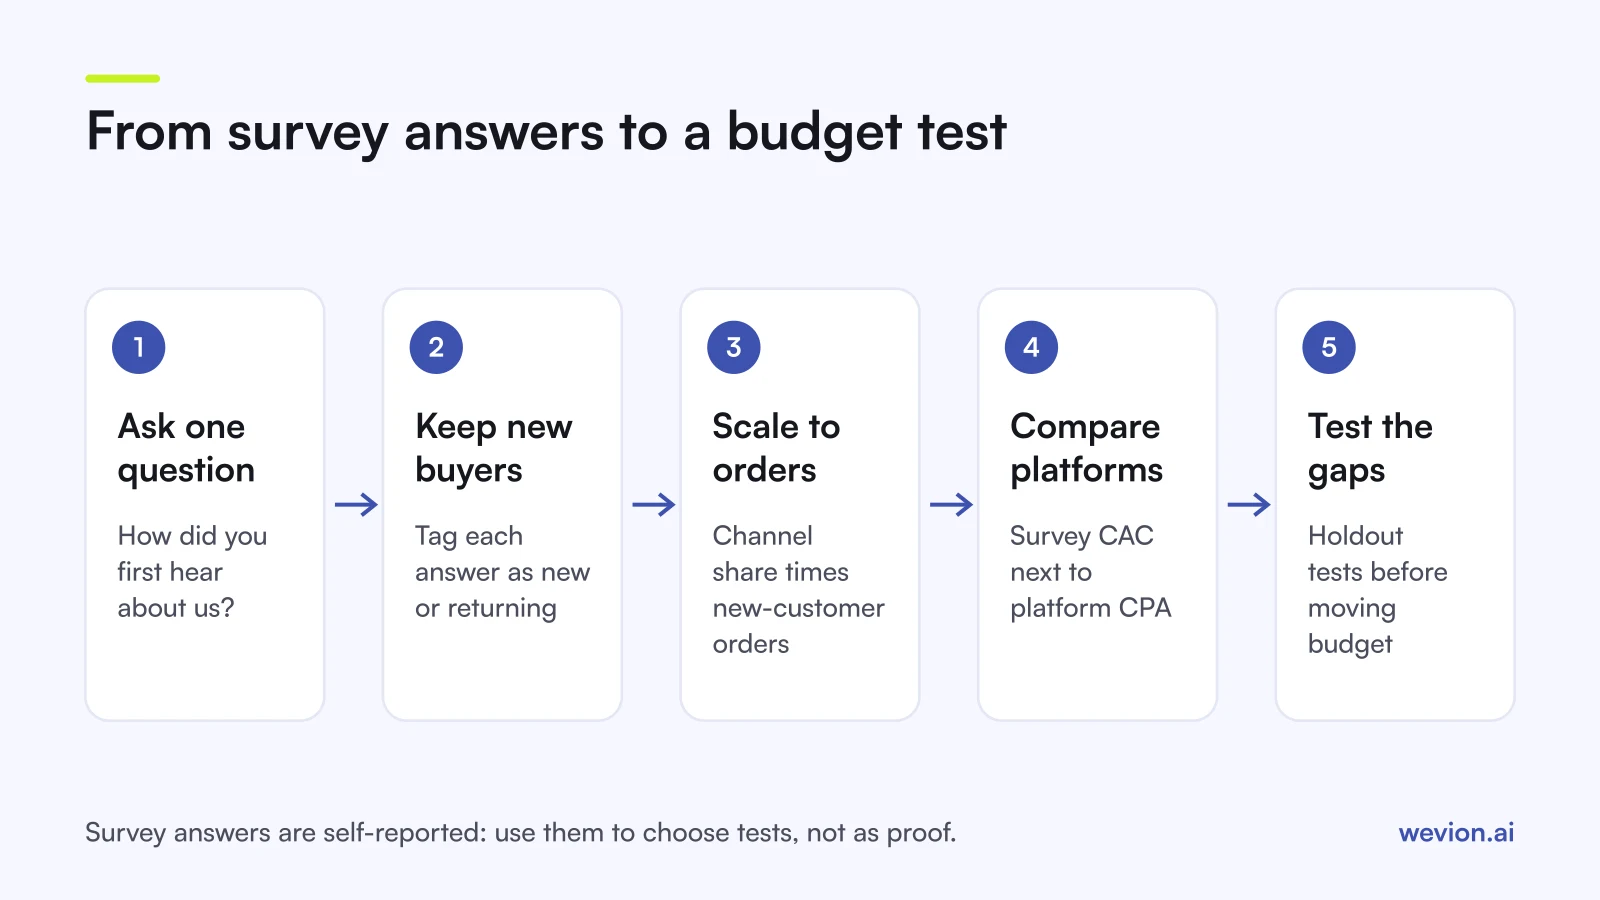
Who to ask. Ask every buyer, but tag each response as new or returning customer from the order. Attribution analysis should use first-time buyers only, because returning customers describe how they came back, not how they found you. Our guide to new customer acquisition cost explains why that split matters for budget.
How many responses do you need?
Survey shares are estimates from a sample, so small samples swing from week to week without anything changing in your marketing.
The margin of error for a share at 95 percent confidence is roughly 1.96 × √(p × (1 − p) ÷ n), where p is the share and n the number of responses. For a channel at 50 percent, the worst case:
| Responses (n) | Margin of error at p = 50% |
|---|---|
| 100 | ± 9.8 points |
| 400 | ± 4.9 points |
| 1,000 | ± 3.1 points |
A brand with 1,500 new-customer orders a month and a hypothetical response rate of 40 percent collects 600 answers, enough to read the main channels monthly. A brand with 200 new customers a month should pool a quarter of answers before drawing conclusions. Channels with a 3 percent share are noise at almost any sample size you will reach: watch them as trends, not as numbers.
How do you compare survey answers with platform-reported results?
The comparison works best as a monthly table that sets the survey's view of new customers next to each platform's reported purchases and spend.
Take a hypothetical month: 1,000 new-customer orders, 400 survey answers from first-time buyers. Scale each channel's share of answers to the 1,000 orders, then compare with what each platform reports.
| Channel | Survey share | Survey-implied new customers | Platform-reported purchases | Spend | Survey CAC | Platform CPA |
|---|---|---|---|---|---|---|
| Meta (Facebook + Instagram) | 35% | 350 | 520 | €20,000 | €57 | €38 |
| TikTok | 20% | 200 | 90 | €8,000 | €40 | €89 |
| 15% | 150 | 300 | €9,000 | €60 | €30 | |
| Podcast, friend, other | 30% | 300 | n/a | n/a | n/a | n/a |
Three readings follow, each one a hypothesis rather than a verdict:
- Meta reports more than the survey implies. Platform purchases include returning customers and view-through credit, so a gap in this direction is normal. The question is whether it is stable month to month.
- TikTok looks better in the survey than in its own pixel. Buyers remember the video but buy later through search. That is a reason to test more TikTok budget, not proof that it works.
- Google looks worse in the survey. Search often captures demand that started elsewhere, so buyers name the channel that made them search. Branded search especially tends to fall here.
Turn each gap into a test. If the survey says TikTok is undervalued, an incrementality test with a holdout region tells you whether extra spend produces extra orders. Keep the business view on blended CAC and MER, which do not depend on any attribution method.
What are the limits of post-purchase surveys?
Surveys are self-reported, so they inherit the ways memory and survey design distort answers. Know these before you defend a budget with them:
- Recall bias. People remember the most vivid or most recent touch, not necessarily the first. A shopper who saw six ads may name the last one, or the friend who confirmed the choice.
- Order effects. Options at the top of the list get picked more often. Shuffling reduces the effect but does not remove it.
- Platform confusion. Buyers mix up Facebook and Instagram, or call a YouTube ad "Google". Combine those options when you compare, if your data shows this.
- Paid vs organic. "Instagram" can mean an ad, a creator post or your own feed. The survey cannot tell them apart unless you ask.
- Non-response. Only buyers who answer are counted. If one channel's buyers answer less often, its share is understated.
- Buyers only. The survey sees nothing about people who saw an ad and did not buy, so it cannot measure efficiency on its own, only mix.
None of these make surveys worthless. They make them directional: a strong signal when they agree with another source, a question to test when they disagree.
Where Wevion fits
Comparing survey answers with platform results each month means pulling spend and reported purchases from every ad platform for the same dates.
Wevion connects Meta ad accounts through the official API with OAuth, plus Google, TikTok, Snapchat, Taboola and Outbrain through each platform's official API, and syncs data about every 15 minutes, so spend and platform-reported results sit side by side in one dashboard. Its cross-channel analytics view puts every account in one currency, which gives you the platform half of the comparison table.
Wevion does not run surveys, change attribution or send events to any platform. The survey answers come from your survey app; Wevion supplies the ad-side numbers you set them against.
You can try it on your own ad accounts with a 14-day trial on the Pro plan. No card to start. We ask for one on day 7, or earlier if you use up the trial credits, and billing starts on day 14 only if you add it.
Key takeaways
- Post-purchase survey attribution asks buyers how they first heard about you, catching channels pixels cannot see.
- On Shopify, survey apps add the question to the thank you or order status page as an app block.
- Ask "How did you first hear about us?", split platforms, shuffle 8 to 12 options and keep "Other" as text.
- Analyse first-time buyers only, and collect a few hundred answers before reading channel shares.
- Compare survey-implied new customers and CAC with each platform's reported purchases and CPA.
- Treat gaps as hypotheses for incrementality tests, because recall and order effects bias every answer.