
CAC Payback Period for Ecommerce: Formula and Cash Impact
Priya Raghunathan
Responsable performance e-commerce
The CAC payback period is the number of months a new customer takes to give back what you spent to acquire them. For a DTC brand it is a cash question more than a profit question: a customer who pays back in month 12 can be very profitable and still leave you short of money for stock and ads in month 3.
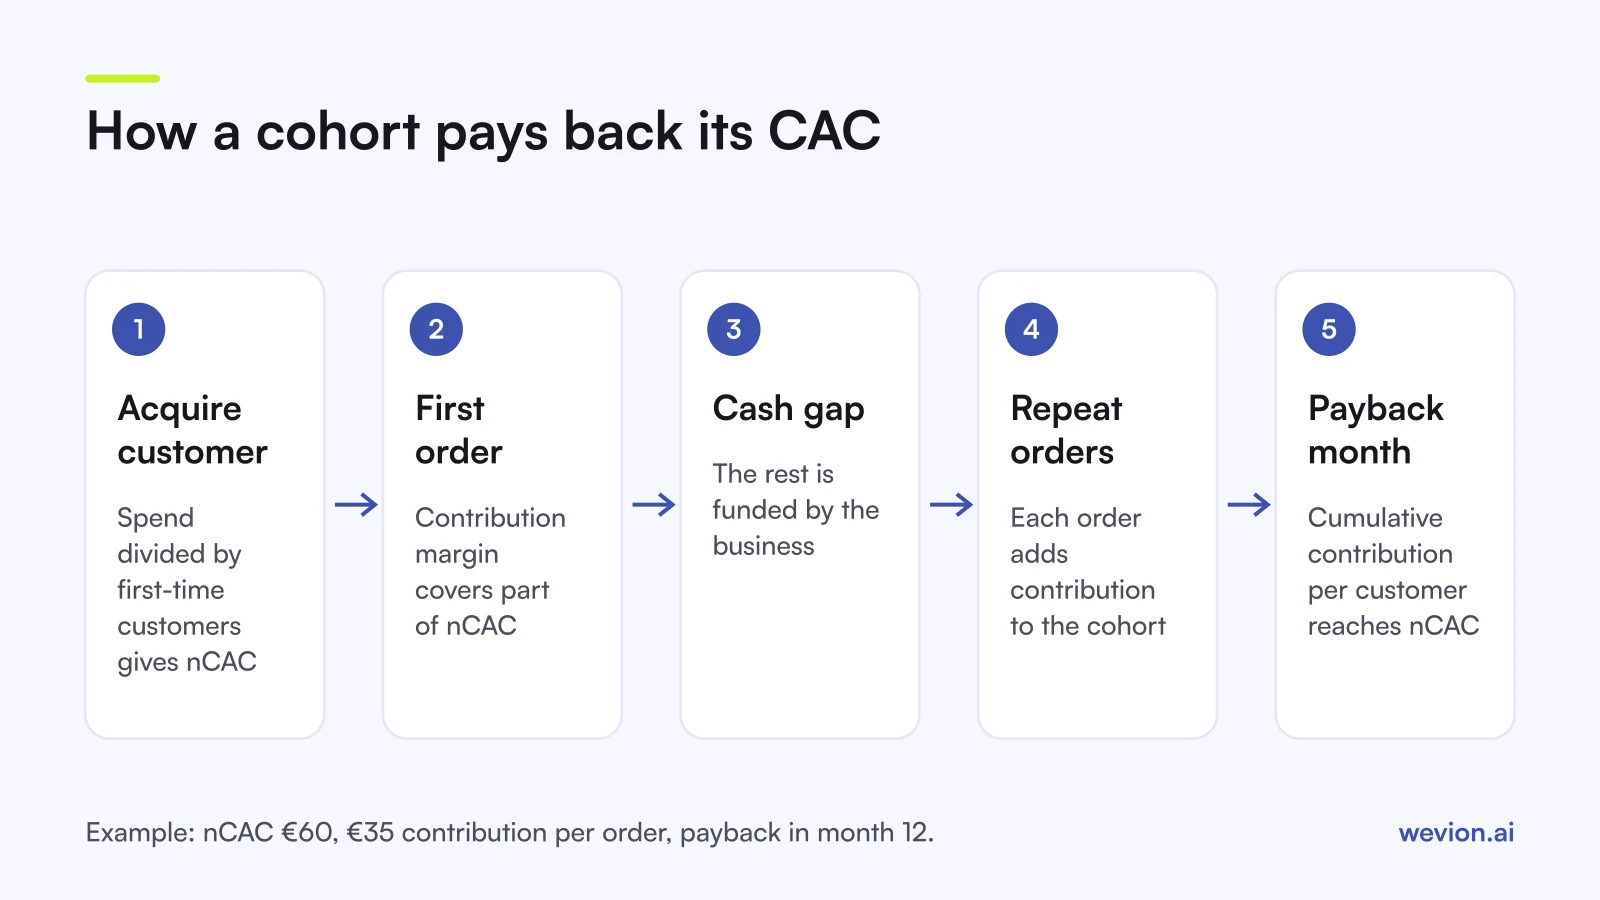
Quick answer: CAC payback period is the first month in which cumulative contribution margin per customer in a cohort reaches the cost of acquiring that customer. Use new customer acquisition cost and contribution margin, not revenue. A short payback lets you scale from cash flow. A long one means every cohort is a loan the business funds until repeat orders repay it.
This guide builds on two companion pieces. The ratio side, and why LTV must use margin, is in our guide to the LTV to CAC ratio. How to count first-time customers is in new customer acquisition cost. Here the focus is the timeline: month by month, and what it does to your cash.
What is the CAC payback period formula?
The CAC payback period formula compares two numbers per customer, one fixed and one growing, and records the month when the growing one catches up.
- Fixed: nCAC = marketing spend in the acquisition month ÷ first-time customers in that month
- Growing: cumulative contribution per customer = contribution margin from every order the cohort has placed so far ÷ customers in the cohort
- CAC payback period = the first month where cumulative contribution per customer ≥ nCAC
A quick estimate, before you have cohort data, is the number of orders it takes:
- Orders to pay back = nCAC ÷ contribution per order
If that answer is 1.0 or less, the first order pays back. If it is 1.7, you need to know how long your customers take to place 0.7 more orders each, which is what the cohort table below shows.
Three definitions decide whether the number means anything:
- Use nCAC, not blended CAC. Dividing spend by every customer who ordered, returning ones included, lowers CAC and shortens payback artificially. Our guide to blended CAC explains when the wider figure is useful and when it misleads.
- Use contribution margin. The margin per order after product cost, shipping, payment fees, packaging and returns. The layers are set out in contribution margin for ecommerce: CM2 is the right base here, because ad spend is the cost being repaid.
- Count months from the first order. Month 0 is the acquisition month. Every customer in the cohort has had the same time to come back.
Why does payback have to use contribution margin?
Contribution margin is the money an order actually leaves behind, so it is the only base on which "paid back" means the cash has returned to the business.
Take an invented first order of €70. On revenue, a customer acquired for €60 has paid back on day one, with €10 to spare. At a CM2 of 50 percent, the same order leaves €35. The customer is still €25 short, and the brand has paid the supplier, the courier and the payment provider out of its own cash. A revenue payback would tell you to scale. A contribution payback tells you each new customer costs €25 of working capital until they order again.
A worked example: one cohort, month by month
The cohort below is invented, with round numbers chosen only to show the method. It is not data from any store.
- March acquisition spend: €24,000
- First-time customers in March: 400, so nCAC is €60
- Every order is €70 of net sales at 50 percent CM2, so each order contributes €35
- Orders to pay back: €60 ÷ €35 ≈ 1.71
| Month since first order | Cumulative orders per customer | Cumulative contribution per customer | Gap to nCAC |
|---|---|---|---|
| 0 | 1.00 | €35.00 | −€25.00 |
| 1 | 1.10 | €38.50 | −€21.50 |
| 2 | 1.18 | €41.30 | −€18.70 |
| 3 | 1.25 | €43.75 | −€16.25 |
| 4 | 1.32 | €46.20 | −€13.80 |
| 5 | 1.38 | €48.30 | −€11.70 |
| 6 | 1.44 | €50.40 | −€9.60 |
| 7 | 1.50 | €52.50 | −€7.50 |
| 8 | 1.56 | €54.60 | −€5.40 |
| 9 | 1.62 | €56.70 | −€3.30 |
| 10 | 1.66 | €58.10 | −€1.90 |
| 11 | 1.70 | €59.50 | −€0.50 |
| 12 | 1.75 | €61.25 | +€1.25 |
This cohort pays back in month 12. Shopify's Customer cohort analysis report groups customers by the date of their first order and tracks their repeat purchases, which gives you the cumulative orders column for your own store. Multiply by your contribution per order and the rest of the table follows.
What does a long payback do to your cash?
A long CAC payback period turns every month of acquisition into a loan, and the loans stack up, because you keep acquiring new cohorts before the old ones have repaid.
In the example, each cohort starts €25 per customer under water, or €10,000 for 400 customers. If the brand acquires 400 new customers every month, after a year it carries twelve cohorts at the same time, aged 0 to 11 months, all still below payback. Add up the gap column for months 0 to 11 and you get €135.15 per customer of one cohort. Multiply by 400 and roughly €54,000 of contribution is tied up in customers who have not yet paid back, on €24,000 of monthly acquisition spend.
That figure is before stock. A brand that pays suppliers ahead of selling needs cash for inventory on top. This is why a store with healthy LTV to CAC can still run out of money while growing: the ratio says the customers are worth it, the payback says when the money arrives.
Short and long payback lead to different operating choices:
| Short payback (first order or within a few months) | Long payback (around a year or more) | |
|---|---|---|
| Cash needed to grow | Little: cohorts repay quickly | Grows with every month of spend |
| How to judge campaigns | First-order margin and POAS on short windows | Quality of customers each campaign brings, tracked by cohort |
| Risk if repeat rates drop | Low: the first order already covered nCAC | High: cohorts never reach payback |
| When to scale | When first-order contribution covers nCAC | When cohort data is stable and cash covers the gap |
How do repeat purchases change payback?
Repeat purchases are the growing half of the formula, so anything that makes customers come back sooner or more often moves the payback month earlier, and anything that slows them pushes it out.
Using the same invented cohort, here are three levers and what each does to the 12-month payback:
- A third more repeat orders. If every point on the repeat curve is a third higher, cumulative orders reach 1.75 by month 8 instead of month 12. Payback: month 8.
- Higher contribution per order. If a bundle or a price change lifts contribution to €40 per order, you need €60 ÷ €40 = 1.5 orders. The original curve reaches 1.50 in month 7. Payback: month 7.
- Lower nCAC. If you acquire the same customers for €50, you need €50 ÷ €35 ≈ 1.43 orders, reached in month 6. Payback: month 6.
Two cautions apply. First, repeat orders won with heavy discounts carry less margin, so check contribution per order on repeat orders separately before counting them. Second, a lower nCAC is only worth having if the new customers repeat like the old ones. Cheaper buyers from a discount-led campaign often reorder less, which can leave payback unchanged or longer.
How do you use payback to set ad spend?
The CAC payback period becomes useful when you turn it into a ceiling on what you pay for a new customer, set from the cash you can afford to tie up.
- Pick a payback window from your cash. Work out how much contribution you can carry, like the €54,000 above, and choose the window that fits it.
- Read the ceiling from the cohort curve. The nCAC ceiling is the cumulative contribution per customer at the end of that window. With a 6-month window, the example cohort supports an nCAC of about €50; with 12 months, about €61.
- Check channels separately. Customers from different channels repeat at different rates. A channel with a higher nCAC can still pay back sooner if its buyers return more often, and the reverse.
- Confirm the channel is adding customers. A channel can look cheap because it claims customers who would have bought anyway. Our guide to incrementality testing covers how to check.
- Rebuild the curve each quarter. Older cohorts gain returns and repeat orders as time passes, so last quarter's curve is never final.
For the first-order line alongside the payback ceiling, our breakeven ROAS calculator uses the same CM2 percentage.
Where Wevion fits
A payback curve needs acquisition spend from every platform on the same dates as your store's first-time customers, and most brands rebuild that join by hand every month.
Wevion connects Meta, Google, TikTok, Snapchat, Taboola and Outbrain ad accounts through each platform's official API, brings Shopify or WooCommerce orders next to that spend in one dashboard, and syncs data about every 15 minutes, so the spend side of every cohort's nCAC is already totalled.
Wevion's Profitability Analytics, in beta, syncs cost per item from your store plus the shipping and fees you set once, and shows profit, margin and POAS, which gives you the contribution per order. The cohort repeat curve comes from your store's own customer reports. Cross-channel analytics converts every account into one currency at each day's exchange rate.
You can try it on your own ad accounts and store with a 14-day trial on the Pro plan. No card to start. We ask for one on day 7, or earlier if you use up the trial credits, and billing starts on day 14 only if you add it.
Key takeaways
- CAC payback period is the first month cumulative contribution per customer reaches nCAC.
- Use contribution margin, not revenue, and nCAC, not blended CAC.
- Orders to pay back = nCAC ÷ contribution per order gives a quick first estimate.
- A long payback stacks cohorts: in the example, €24,000 of monthly spend ties up about €54,000.
- More repeat orders, higher contribution per order and lower nCAC all shorten payback.
- Set your nCAC ceiling from the payback window your cash can carry, channel by channel.