
Looker Studio Facebook Ads Template for Client Reports
Marta Kowalczyk
مسؤول عمليات الوكالة
A Looker Studio Facebook ads template is a reusable report that an agency copies for each client, points at that client's Meta ad account and sends on a schedule. The template part is easy. The hard part is that Looker Studio has no connector built by Google for Meta ads, so you must choose how the data gets in before you design a single chart.
Quick answer: Pick a data route first: a partner connector from Looker Studio's connector gallery, exported files in Google Sheets, or a BigQuery transfer. Then build five pages: overview, campaigns, creative, funnel with GA4, and notes. Recalculate every ratio as a calculated field, blend GA4 on date and campaign name, and copy the finished report for each client.
This guide focuses on Meta. For native networks, see how to connect Taboola and Outbrain to Looker Studio, and for a report that covers every channel, our guide to a cross-channel ad reporting dashboard.
A naming note: on 11 April 2026 Google's Cloud blog announced it was bringing back the name Data Studio for Looker Studio, with existing reports moving over with no action needed. Many connector listings now use the new name. Everything here applies under both.
Does Looker Studio have a Facebook Ads connector?
Looker Studio has no Google-built connector for Facebook or Meta ads, which is why every Meta report starts with a choice of route. Google's data source overview describes its own connectors as free connectors built by Google, such as Google Sheets, Google Ads and Google Analytics. Partner connectors are built by Data Studio partners, and they can cost money.
You have three realistic routes:
| Route | Refresh | Setup effort | Best for |
|---|---|---|---|
| Partner connector | Set by the vendor | Low | Agencies with many clients on Meta |
| Exported files in Google Sheets | When you update the sheet | Low, but manual | Monthly reports, few clients |
| BigQuery transfer | At most daily | Medium to high | Teams that already use BigQuery |
Partner connectors. Several vendors document a Facebook Ads connector for Looker Studio on their own sites, including Supermetrics, Windsor.ai and Dataslayer. Supermetrics and Windsor.ai also offer ready-made Facebook ads report templates. Search for "Facebook Ads" in the connector gallery to see the current list, and check each vendor's pricing page, because most charge per account or data source.
Google Sheets. Export a report from Ads Manager, paste it into a sheet with fixed columns, and connect the sheet with Google's Sheets connector. It costs nothing but someone's time every reporting cycle.
BigQuery. Google's BigQuery Data Transfer Service for Facebook Ads loads a fixed set of tables, such as campaigns, ad sets, ads and ad insights. The minimum interval between transfers is 24 hours, it needs a Meta developer app, and the long-lived user access token it uses expires after 60 days unless you use a system user token. Looker Studio then reads the tables through the BigQuery connector.
Which pages should a Facebook ads template have?
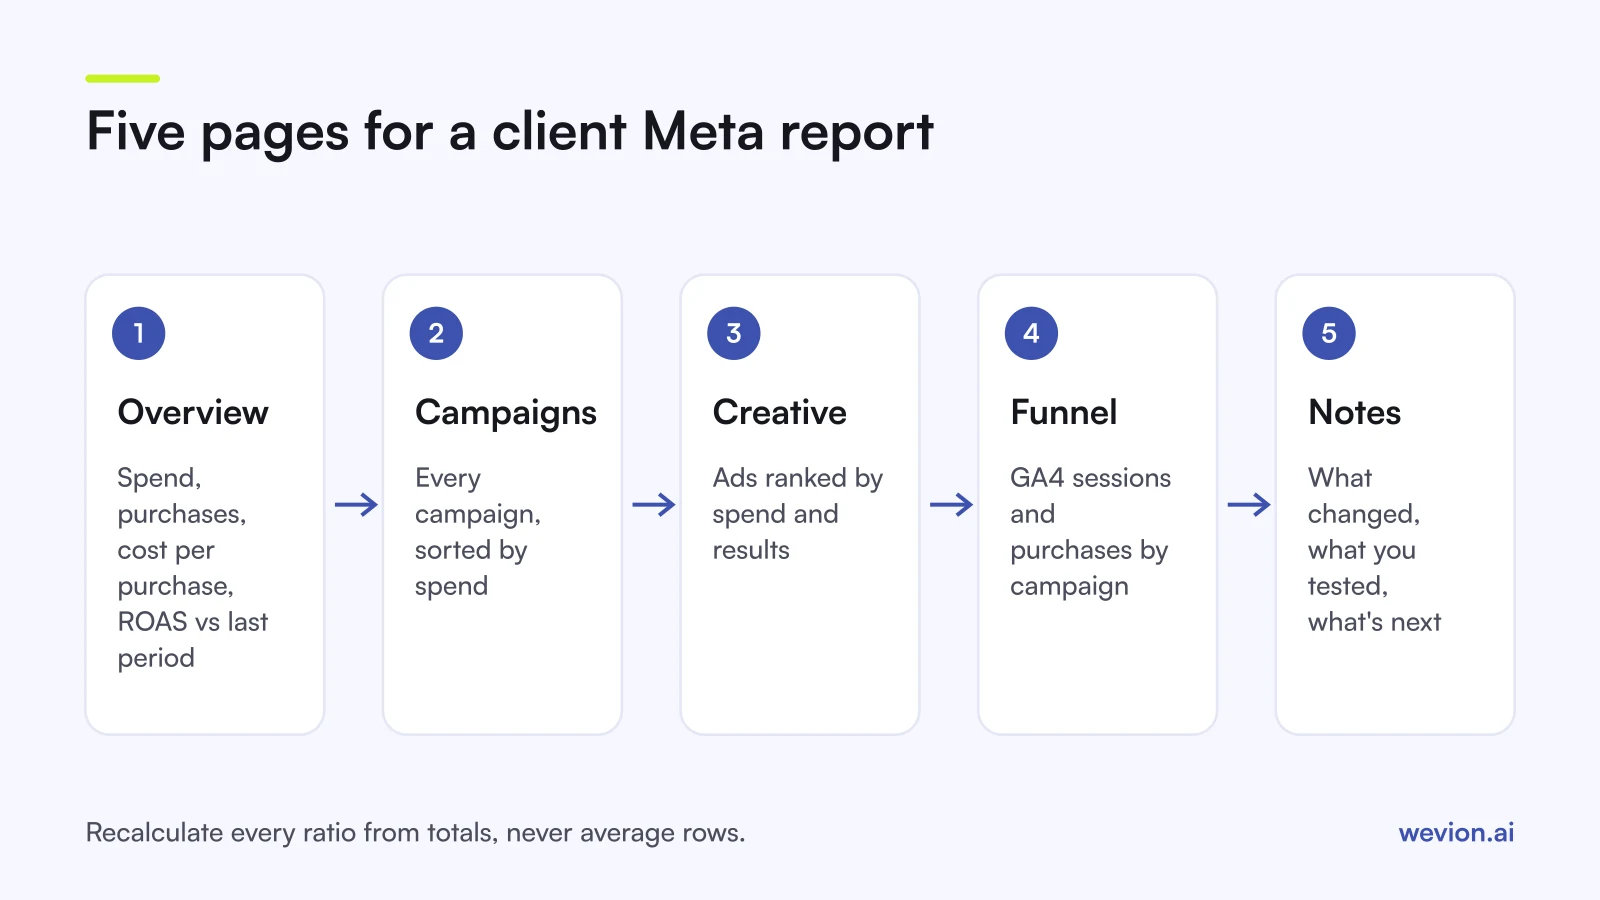
A client report template should answer the questions clients ask in the order they ask them: how much did we spend, what did we get, what worked, and what happens next. Five pages cover that for most ecommerce clients.
- Overview. Scorecards for spend, purchases, purchase value, cost per purchase and ROAS, each compared with the previous period, plus a daily spend and results chart.
- Campaigns. One table with every campaign: spend, results, cost per result, ROAS, click-through rate and frequency. Sort by spend.
- Creative. Ads ranked by spend with their results. If your connector exposes thumbnails or ad names that describe the creative, this becomes the page clients read first.
- Funnel. GA4 sessions, engagement and purchases by campaign, next to Meta's own figures.
- Notes. A text box with what changed this period, what you tested and what you plan next. Clients value this more than an extra chart.
Our guide to reporting Facebook ads to clients covers which metrics clients care about and how often to send them.
Which metrics and calculated fields should you build?
The most common error in a Looker Studio Meta report is a ratio averaged across rows, so build every ratio as a calculated field from totals. A campaign table that averages ROAS gives a small campaign the same weight as a large one.
| Metric | Calculated field | Why |
|---|---|---|
| Cost per purchase | SUM(Spend) / SUM(Purchases) | Weighted by volume, matches Ads Manager totals |
| ROAS | SUM(Purchase value) / SUM(Spend) | Same reason |
| CTR | SUM(Link clicks) / SUM(Impressions) | Averaging percentages misleads |
| CPM | SUM(Spend) / SUM(Impressions) × 1,000 | Comparable across periods |
Field names differ by connector, so map them once in the template. Also check two connector settings that change every number on the page: the attribution setting used for conversions, and the account time zone. If either differs from what the client sees in Ads Manager, the report will not match.
A short worked example shows the averaging trap. Campaign A spent €900 and returned €3,600, a ROAS of 4.0. Campaign B spent €100 and returned €100, a ROAS of 1.0. Averaging the two rows gives 2.5. The correct blended figure is €3,700 divided by €1,000, or 3.7.
How do you blend Meta ads data with GA4?
Blending puts Meta's spend next to GA4's site behaviour, which is useful as long as you treat the two as different views rather than one truth. Google's guide to how blends work says a blend can include up to five data sources, joined with inner, left outer, right outer, full outer or cross joins.
A working setup for a Meta and GA4 blend:
- Table 1: your Meta data source, with date, campaign name, spend, purchases and purchase value.
- Table 2: GA4, with date, session campaign, sessions and purchases.
- Join: left outer on date and campaign name equals session campaign, so every Meta row stays even when GA4 has no matching sessions.
- Calculated fields: cost per GA4 purchase, using Meta spend divided by GA4 purchases, clearly labelled as such.
The join only works if the utm_campaign value on your Meta ads matches the campaign name. Our UTM parameter guide for Meta ads shows how to set this with dynamic parameters.
Expect GA4 purchases and Meta purchases to differ. Meta counts conversions under the ad set's attribution setting, which can include people who only saw an ad, while GA4 credits sessions using its own model. Show both, name the source on each chart, and explain the gap once to the client rather than every month. Our piece on why ad platforms double count conversions has a version you can adapt.
How do you reuse the template across clients?
A template saves time only when copying it for a new client takes minutes, so build it for reuse from the start.
- One data source per client. Point each client's copy at their own ad account rather than filtering one shared source, so a filter mistake cannot show one client another client's data.
- Copy the report, then swap the data source. Looker Studio asks you to choose a replacement source for each one when you copy a report.
- Use controls. A date range control on every page and, if the client has several ad accounts, an account control.
- Fix the theme once. Colours, logo position and fonts live in the theme, so each copy only needs the client's logo.
- Check data credentials. Decide whether each data source uses the owner's credentials or the viewer's, because a client who opens the report needs to see the data without their own connector login.
What are the limits of Looker Studio for Meta reporting?
Looker Studio is a capable free reporting layer, but a Meta report built on it has limits that are worth naming before you promise a client a live dashboard.
- Connector cost and dependency. Partner connectors are usually priced per account or source, and when Meta changes its API, your reports depend on the vendor updating the connector.
- Freshness. Recent days can change as Meta updates conversions, and the BigQuery route refreshes daily at most.
- Five sources per blend. A report that blends Meta, Google Ads, TikTok, GA4 and store data hits the limit quickly. At that point a warehouse is the cleaner route.
- Speed. Large tables and many blends make pages slow to load, especially in client meetings.
- It only reports. Looker Studio shows results; changing a budget still means opening Ads Manager.
For a wider look at options that do not need a connector at all, see our comparison of Facebook ads reporting tools.
Where Wevion fits
Many agencies build a Looker Studio report because their Meta, Google and TikTok numbers never sit in one place otherwise. Wevion approaches the same problem from the other side.
Wevion connects Meta, Google, TikTok, Snapchat, Taboola and Outbrain ad accounts through each platform's official API, syncs data about every 15 minutes, and shows every client's spend and results in one cross-channel view, with one workspace per client, so no connector or blend is needed for day-to-day checks.
To be clear about the limits: Wevion has no Looker Studio connector. In cross-channel analytics you can download the active view's daily data as CSV or Excel and upload it to Looker Studio if a client wants their report there. Team roles such as manager, media buyer, finance and viewer keep each person to the clients they work on.
Start a 14-day trial with no card. We ask for one on day 7, or earlier if you use up the trial credits, and billing starts on day 14 only if you add it.
Key takeaways
- Looker Studio, now called Data Studio again, has no Google-built connector for Meta ads.
- Choose a route first: a partner connector, exported files in Google Sheets, or a daily BigQuery transfer.
- Build five pages: overview, campaigns, creative, funnel with GA4, and notes.
- Recalculate every ratio, such as ROAS and cost per purchase, from totals in a calculated field.
- Blend GA4 on date and campaign name, with UTM values that match Meta campaign names.
- One data source per client and a copied report keep client data apart.