
Incrementality Testing for Ecommerce: Holdouts, Geo Tests and Lift
Priya Raghunathan
E-Commerce Performance Manager
Incrementality testing answers the question attribution cannot: how many of your sales would not have happened without the ads? Attribution reports tell you which ad got credit for an order. A controlled test compares people or regions that saw your ads with comparable ones that did not, and the difference is what the ads actually added.
Quick answer: Incrementality testing measures the extra conversions caused by ads by comparing an exposed group with a control group that is kept from seeing them. The three common designs are audience holdouts, geo tests and platform lift studies such as Meta Conversion Lift and Google Ads Conversion Lift. Read the result as a range, not a single figure, and check the sample size before acting on it.
Our article on why Meta and Shopify numbers don't match ends where this one starts: Shopify's last-click count and Meta's own count bracket Meta's real contribution, and only a test tells you where it sits. For the store-level view that needs no test, see MER vs ROAS.
What does incrementality testing measure?
Incrementality testing measures the causal effect of ads: the conversions in the exposed group minus the conversions the same group would have made anyway, estimated from a control group.
Attribution and incrementality answer different questions:
- Attribution: of the orders that happened, which touchpoint gets credit? Every order is assigned somewhere, including orders that would have happened without any ad.
- Incrementality: how many orders happened because of the ads? Orders from people who were going to buy anyway count as zero.
The gap between the two is largest where ads reach people already close to buying: retargeting, branded search and campaigns aimed at existing customers. It also explains why platforms' summed conversions exceed your store's orders, which our guide to ad platforms double counting conversions covers.
What are the main incrementality test designs?
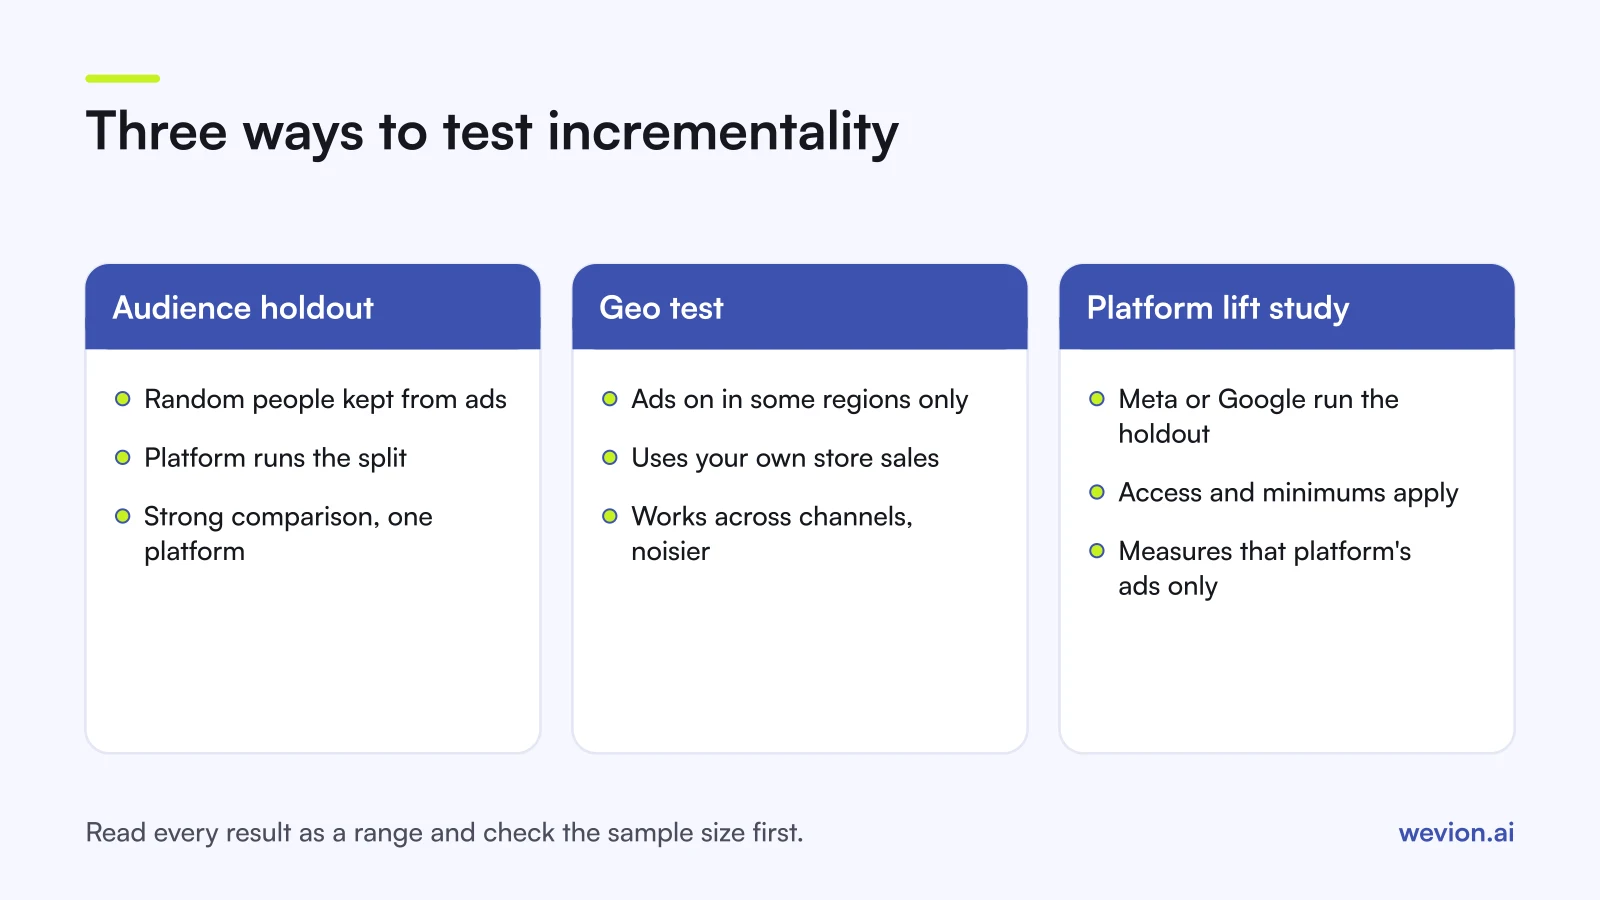
There are three practical designs for a DTC brand, and they differ in what gets split, who runs the analysis and what data you need.
Audience holdout. A random share of the target audience is kept from seeing the ads. Everything else stays the same. Because people are assigned at random, the control group is a fair estimate of what the exposed group would have done. The platform has to run the split, because only it knows who would have been shown an ad.
Geo test. Ads run in some regions and not in others, or a channel is switched off in some regions. You choose test and control regions that behaved alike before the test, then compare sales. Geo tests can use your own store data, cover any channel, and need no help from the platform. The trade-off is that you have a handful of regions instead of thousands of people, so results are noisier.
Platform lift study. Meta and Google both offer a managed version of the holdout, run inside their systems with their own analysis. Details are in the next section.
A fourth approach, switching a channel off for everyone for two weeks and comparing with the two weeks before, is cheap but weak. Seasonality, promotions and other channels change at the same time, so the before and after periods are not comparable. Use it only as a rough sense check.
What do Meta and Google's lift studies offer?
Both platforms describe conversion lift as a randomised experiment with a group that sees ads and a group that does not, but access and requirements differ, so check the current documentation before planning one.
Meta Conversion Lift. Meta's Marketing API guide to lift studies describes a randomised test group that sees your ads and a control group that does not, with Meta assigning people to each. It compares conversions and sales between the two groups to determine the increase the campaign generated. The same page says "Conversion Lift Measurement is currently limited" and asks advertisers to contact their Meta representative for access. Results for a breakdown are shown only when test and control groups together have at least 100 conversions.
Google Ads Conversion Lift. Google's help page on Conversion Lift based on users says it is not available for all accounts and points advertisers to their Google account representative. As listed there today:
- Supported campaign types include Display, Search, Video, Demand Gen, App and Performance Max, with some exclusions.
- At least 1,000 observed conversions and a minimum campaign budget of 5,000 US dollars.
- A holdback of between 1 and 50 percent of the audience.
- Studies can be as short as 7 days, but Google typically recommends more than 14.
- Study power is shown from 50 to 95 percent; Google suggests aiming for 90 percent or higher and treats results between 50 and 90 percent as directional.
Google also offers Conversion Lift based on geography, which splits by region. Its comparison of lift types notes that the geography split is noisier and usually needs a higher budget than the user-based one, but supports online and offline conversions.
A platform study measures that platform's ads against that platform's own conversion tracking. It cannot tell you what the ads did to sales elsewhere, and it is still the platform grading its own work, even if the method is sound.
How do you read lift results?
Reading lift results means turning two conversion counts into three numbers: incremental conversions, relative lift and cost per incremental conversion.
Here is an invented audience holdout. The numbers are chosen to add up, not taken from any study.
- Test group: 900,000 people, 2,700 purchases, a rate of 0.30 percent
- Control group: 100,000 people, 240 purchases, a rate of 0.24 percent
- Spend on the test group: €40,000
- Purchases the platform attributed to the campaign: 1,800
The calculation:
- Expected purchases without ads = control rate × test group size = 0.24% × 900,000 = 2,160
- Incremental purchases = 2,700 − 2,160 = 540
- Relative lift = (0.30% − 0.24%) ÷ 0.24% = 25 percent
- Cost per incremental purchase = €40,000 ÷ 540 = €74.07
Compare that with the attributed figure. On 1,800 attributed purchases, the platform's cost per purchase is €22.22. Only 540 of those, or 30 percent, were incremental in this example. The rest would have happened anyway. That does not mean the campaign failed: it means the right number for budget decisions is €74.07, compared with your CAC payback ceiling and first-order margin.
For a geo test, the logic is the same with sales by region. Suppose, again invented, test regions sold €200,000 and control regions €250,000 in the eight weeks before, a ratio of 0.8. During the test, a new channel runs only in the test regions, which sell €230,000 while control regions sell €260,000. Expected test sales are 0.8 × €260,000 = €208,000, so incremental sales are €22,000. On €10,000 of spend that is an incremental ROAS of 2.2. At a 45 percent contribution margin, €22,000 of sales leaves €9,900, slightly less than the spend. The test shows real lift and a small loss at the same time, which is why profit-based measures such as POAS belong next to the lift result.
Why does sample size matter so much?
Sample size decides how wide the range around your lift figure is, and with small control groups that range can be wider than the lift itself.
In the holdout example, the control group had 240 purchases. Purchase counts vary by chance; for a count like this, a rough 95 percent range is plus or minus about twice its square root (√240 ≈ 15.5), so roughly 210 to 270. Run the same calculation at each end:
- Low control (210): expected purchases 1,890, lift about 43 percent
- High control (270): expected purchases 2,430, lift about 11 percent
So the honest reading of the example is "somewhere between about 11 and 43 percent", not "25 percent". This rough check ignores noise in the test group and is no substitute for the platform's own statistics, but it shows the scale of the problem. Practical rules that follow:
- Plan the size before you start. Use the platform's power estimate or a sample size calculator. If the test cannot reach enough conversions, a longer test or a larger holdback helps more than a shorter, cheaper one.
- Change nothing during the test. Google's help page discourages changing creatives or audiences during a study, because it can affect results.
- Avoid big calendar events unless they are what you want to measure. A sale week moves both groups, but rarely by the same amount.
- Repeat tests that drive large decisions. One test is one reading. Our guide to statistical A/B testing on Facebook covers the same discipline for creative tests.
How should a DTC brand start?
A DTC brand should start incrementality testing where the gap between attributed and incremental results is most likely to be large and the budget at stake is biggest.
- Pick one question. For example: does retargeting add sales, or does a new channel add customers beyond Meta? Our guide to diversifying ad channels beyond Meta suggests a region holdout for the second case.
- Choose the design you can run. If you have access to a platform lift study, use it for that platform. If not, a geo test on your store sales is the most accessible option.
- Fix the success metric in advance. Incremental purchases, incremental first-time customers or incremental contribution. Decide before you see the result.
- Write down the decision rule. For example: keep the channel if cost per incremental new customer stays below the payback ceiling.
- Apply the result as a factor. If a channel shows 30 percent incrementality, divide its attributed CPA by 0.3 when you compare it with other channels, until the next test.
Where Wevion fits
Incrementality tests are run in the ad platforms or in your own analysis, but a geo test still needs spend from every account on the same dates as your store sales, split cleanly by region and period.
Wevion connects Meta, Google, TikTok, Snapchat, Taboola and Outbrain ad accounts through each platform's official API, brings Shopify or WooCommerce orders next to that spend in one dashboard, and syncs data about every 15 minutes, so platform-reported results and store sales sit side by side during a test.
Wevion does not run lift studies, decide attribution or deduplicate conversions. Cross-channel analytics lets you filter by date and account and converts every account into one currency at each day's exchange rate, which keeps the spend side of an incremental ROAS consistent.
You can try it on your own ad accounts and store with a 14-day trial on the Pro plan. No card to start. We ask for one on day 7, or earlier if you use up the trial credits, and billing starts on day 14 only if you add it.
Key takeaways
- Incrementality testing measures sales caused by ads; attribution measures sales credited to them.
- Audience holdouts split people, geo tests split regions, platform lift studies run the holdout for you.
- Meta's Conversion Lift is limited and needs a Meta representative; Google lists 1,000 observed conversions and a 5,000 US dollar budget for user-based lift.
- Read results as incremental conversions, relative lift and cost per incremental conversion.
- Small control groups give wide ranges: plan sample size before you start and change nothing during the test.